

Reading Graphs Digital Activities for Special Education | Distance Learning
$5.00
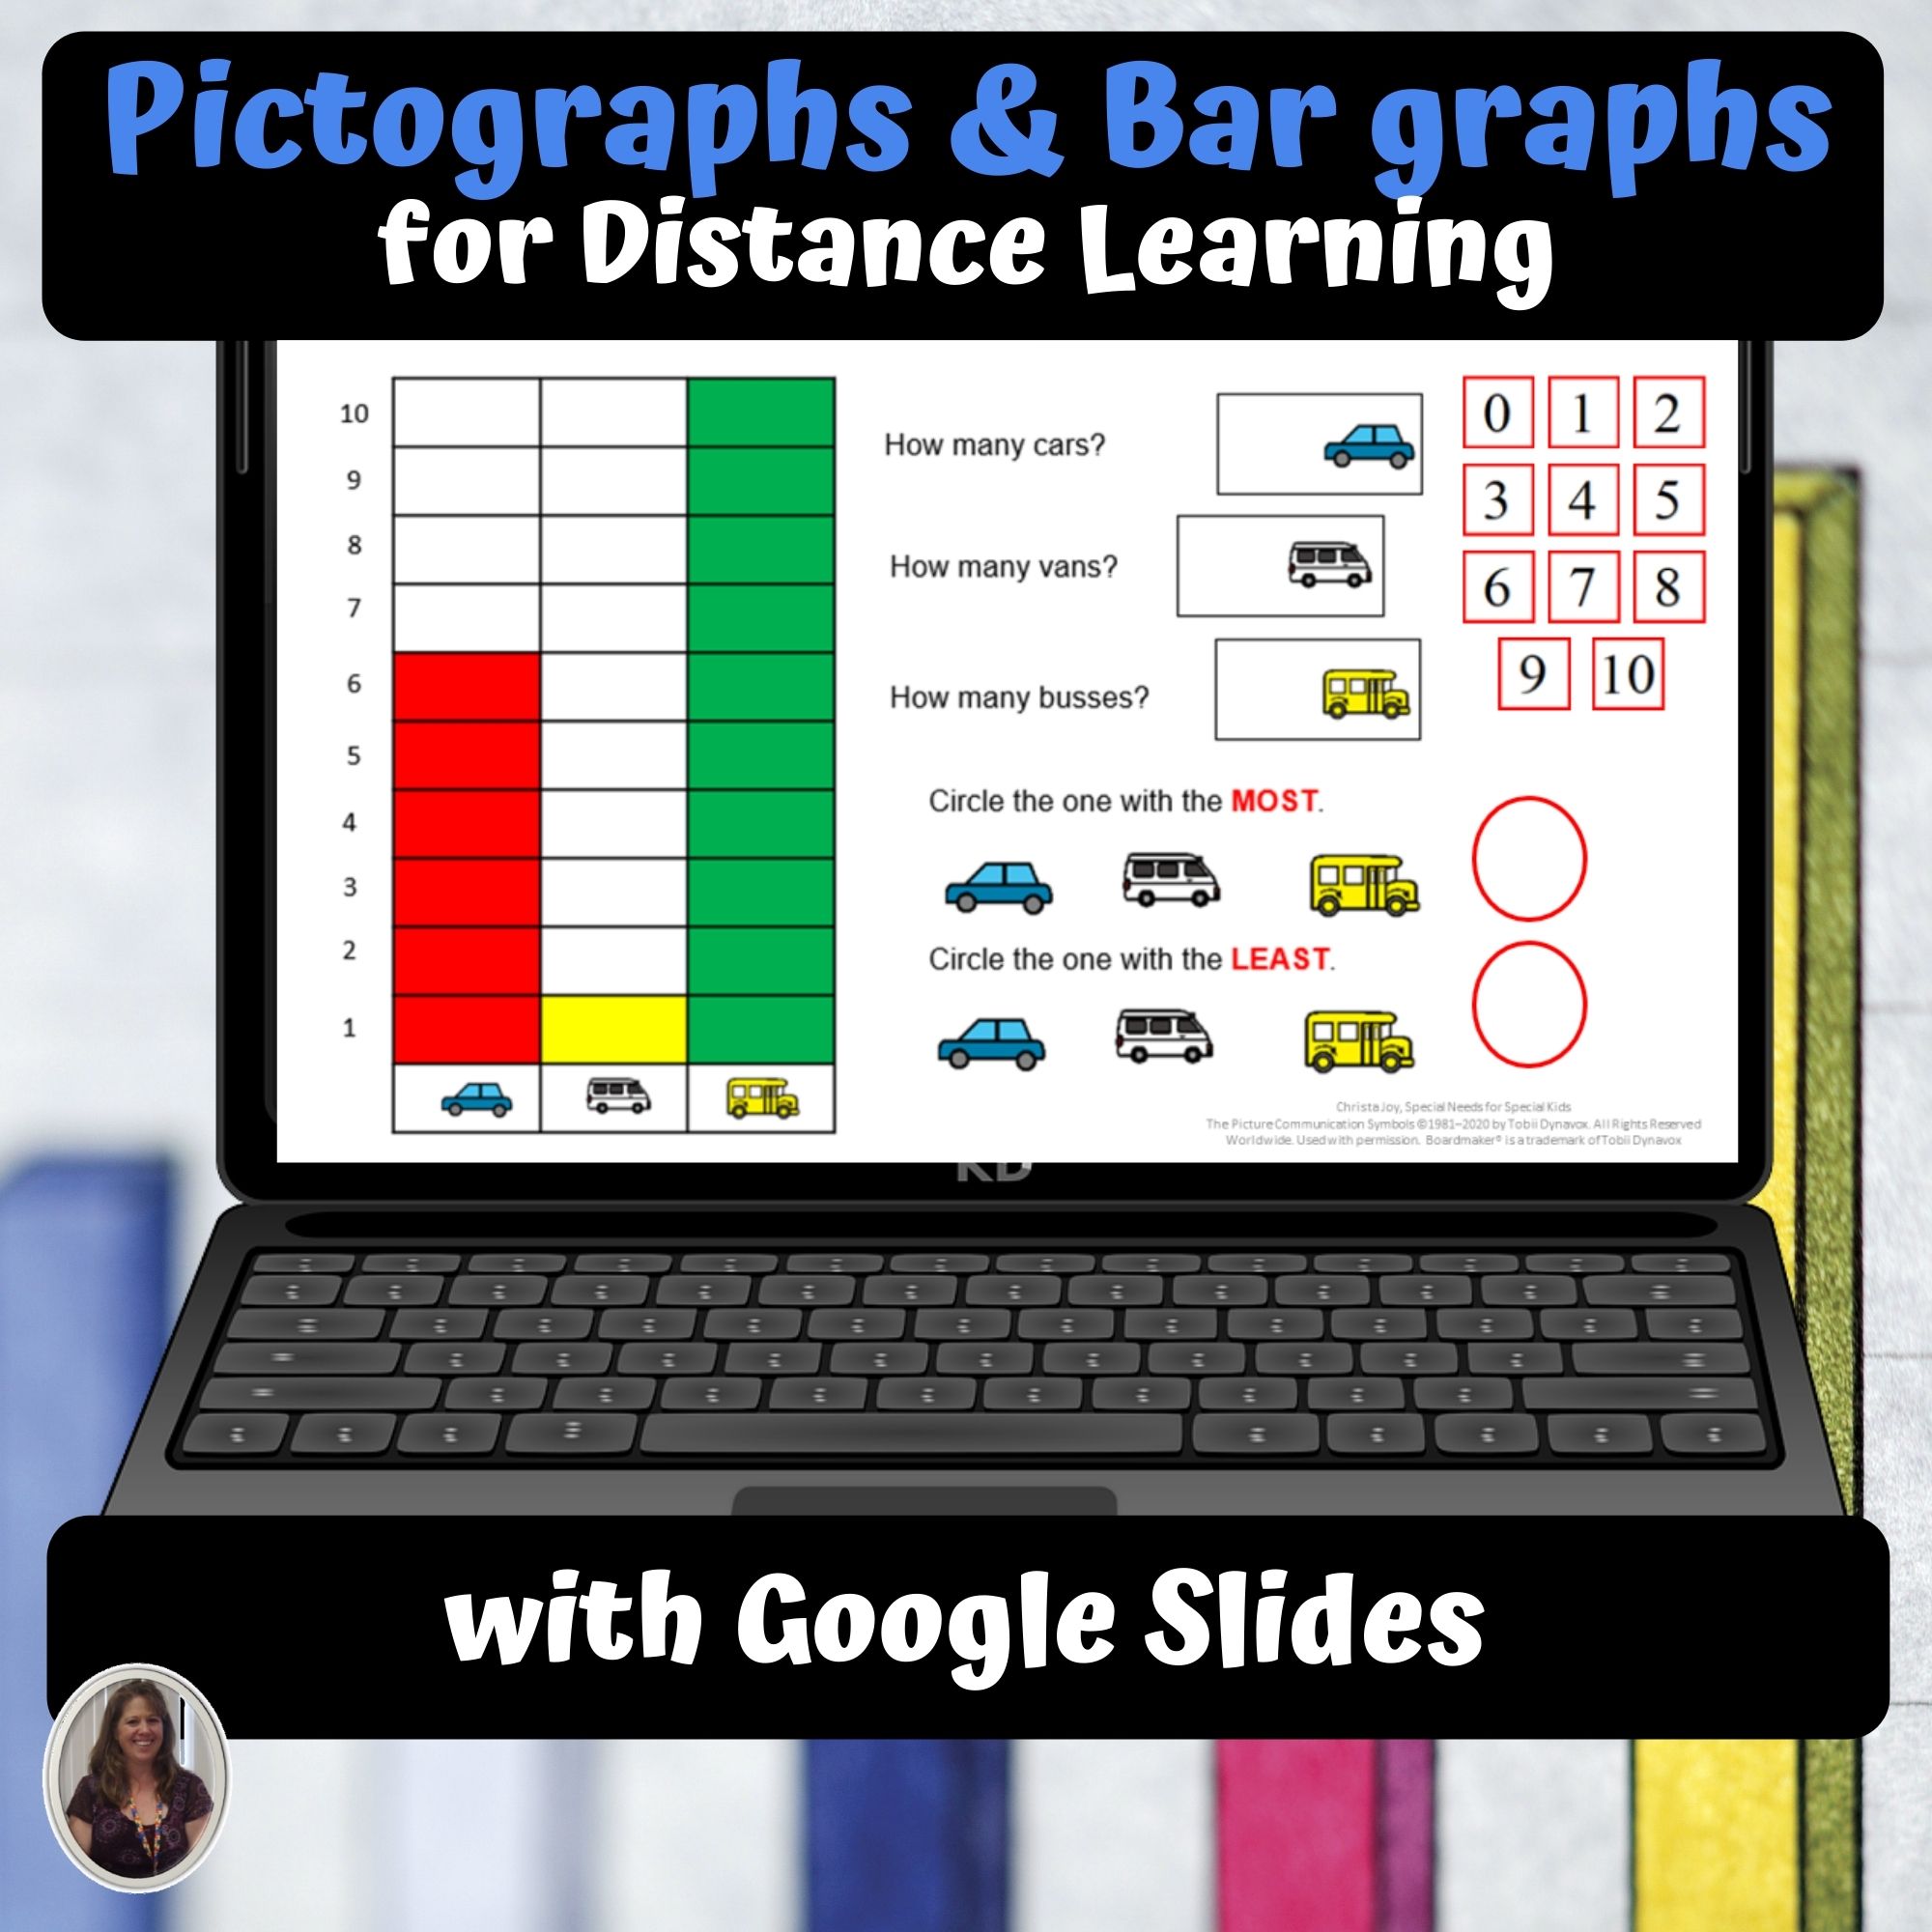
This resource is perfect if you have students who need more practice with reading pictographs and bar graphs. Students will count the quantity of 3 different objects and then circle the one that has the most and the one that has the least.
- There are 20 slides using pictographs that have quantities up to 10.
- There are 20 slides using bar graphs that have quantities up to 10.
- There are directions on how to assign these to students and a quick way to differentiate them for students who are easily overwhelmed or need more support.
These activities are the perfect accompaniment to my Bar Graph Bundle that is a printable unit. CLICK HERE
Post Views: 1,777
$5.00
Lorem.